In the December 2020 release of Azure API Management, there was a release note that drew my attention:
You can now log API inspector traces to Application Insights and Azure Monitor by setting the verbosity property of the service/diagnostics resource to debug. Azure portal interface for this feature will be released in early 2021.
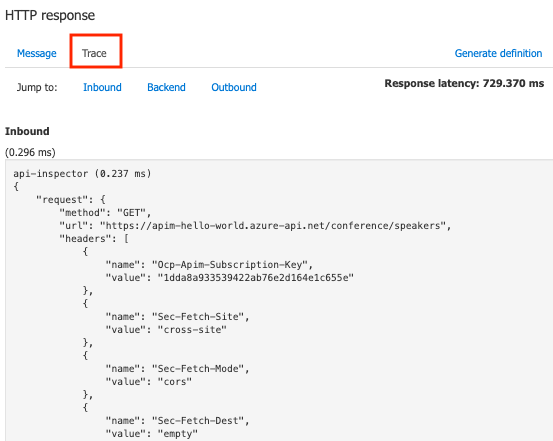
What are API inspector traces?
All of this is explained in this documentation. In short, these API inspector traces include every single aspect of the policy executions during the handling of an API call. This includes, the Inbound, Backend, Outbound, OnError sections of the policies on Global, Product, API or Operation level.

These traces are very handy during development, but they cannot be consulted on a production instance. That’s why it is very handy to send these traces to Application Insights.
How to send them Application Insights?
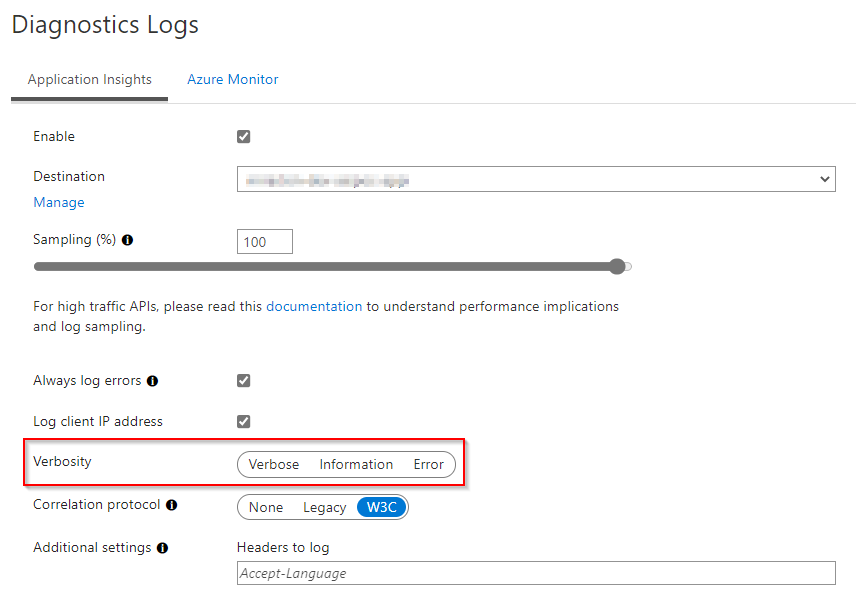
You must set the verbosity of your Application Insights configuration to debug. At the time of writing, this is not yet supported in the Azure portal. Luckily, you can enable this already via Infrastructure as Code. Checkout this bicep sample that sets the trace level to debug and ensures that all request/response bodies are tracked to Application Insights. Remark that the API version 2020-06-01-preview should be used.
//Describe global API Management settings for Application Insights
resource apimGlobalAppInsightsSettings 'Microsoft.ApiManagement/service/diagnostics@2020-06-01-preview' = {
   name: 'applicationinsights'
   parent: apiMgmt
   properties: {
      loggerId: apimLogger.id
      alwaysLog: 'allErrors'
      httpCorrelationProtocol: 'W3C'
      verbosity: 'debug'
      frontend: {
         request: {
            headers: []
            body: {
               bytes: 8192
            }
         }
         response: {
            headers: []
            body: {
               bytes: 8192
            }
         }
      }
      backend: {
         request: {
            headers: []
            body: {
               bytes: 8192
            }
         }
         response: {
            headers: []
            body: {
               bytes: 8192
            }
         }
      }
   }
}
As a result, you will see that none of the options in the Azure portal is checked 🙂

What’s the result?
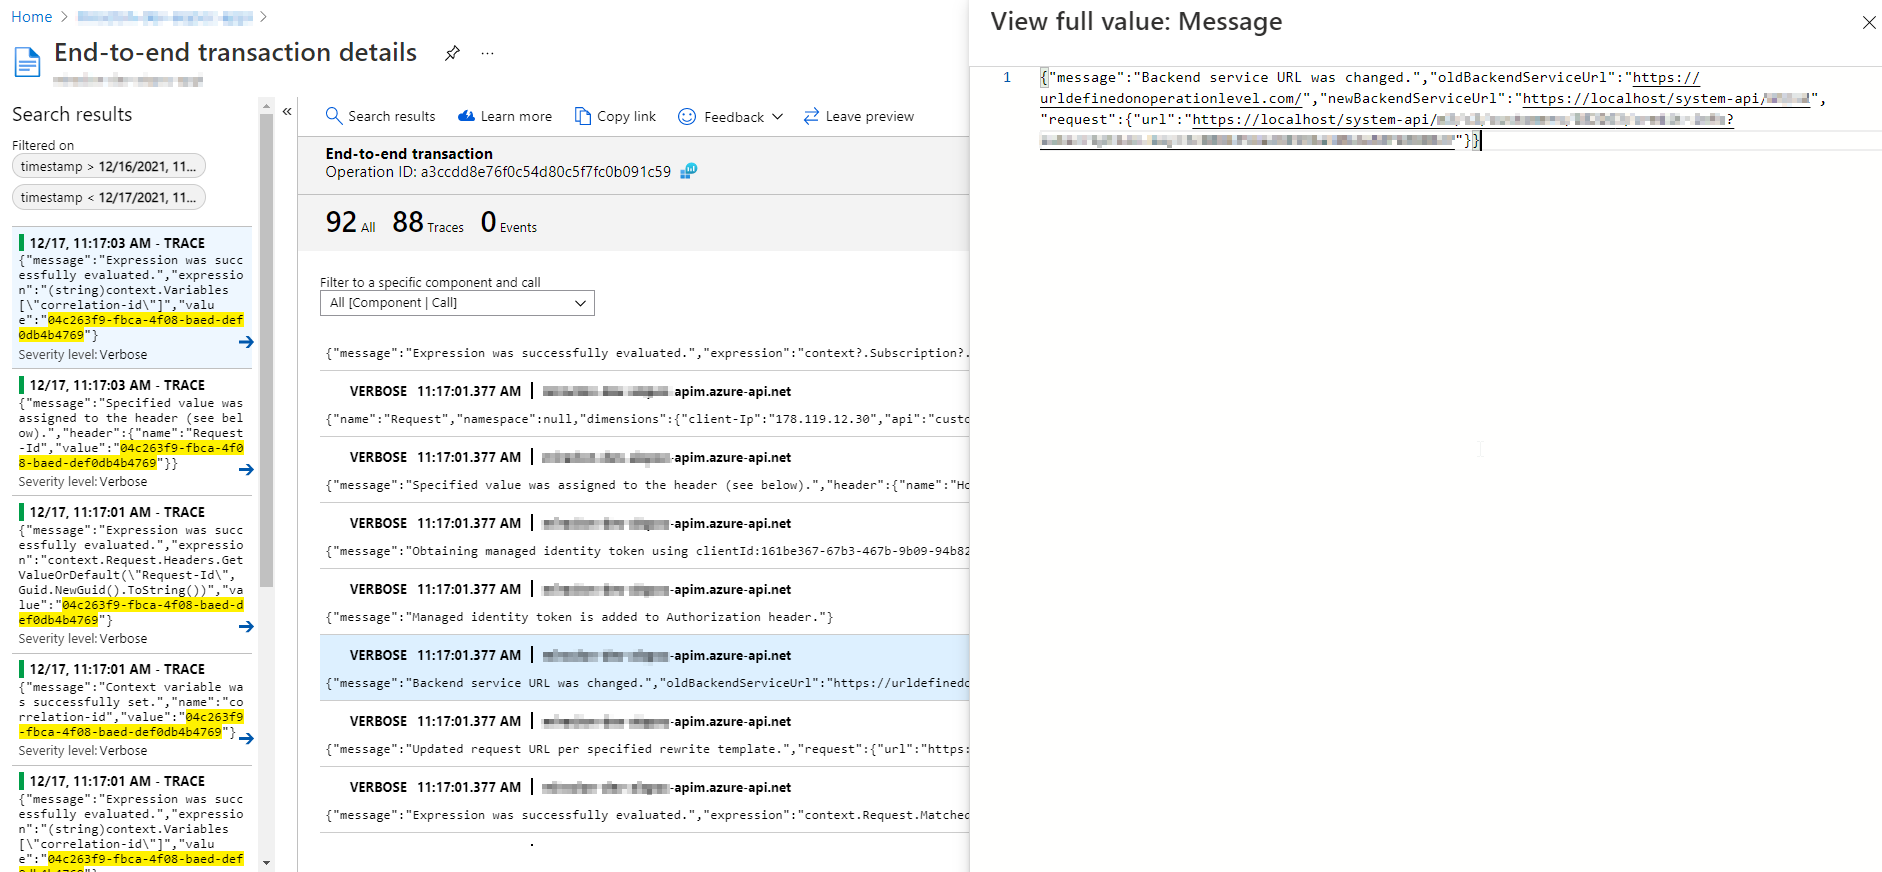
All these detailed traces can be found back inside Application Insights. Ensure that you can link these traces back to a single API call, as described in this blog post. This is how the result looks like:

Conclusion
This is a very handy feature to investigate what happened with a specific API call on production. This definitely has an impact on your performance if you enable this globally. My advise is to enable this temporary during troubleshooting or after new releases, when the chance of issue is a bit bigger.
Cheers!
Toon


