In the July release of Azure API Management, they’ve added the feature to emit custom metrics to Application Insights. If you follow my blog, you know that I pay a lot of attention to monitoring, so this is a feature that I definitely wanted to check. I can tell you already: it’s very valuable and I am starting to leverage it across my projects.
Enable the preview
At the time of writing, this is still a preview feature of Application Insights. To enable it, navigate to the Application Insights instance that is configured for API Management.
Be aware that this can be configured on global and/or API level!
Within the Application Insights instance, you can navigate to the Usage and estimated costs tab. Ensure that you check the Enable alerting on custom metric dimensions.

Configure the policy
The documentation of the emit-metric policy can be found here. It allows to create a custom metric within a custom namespace. You can assign custom dimensions to every metric. These are key-value pairs that provide additional context about the metric.
To test this policy, I am calling an Order API with random API requests, as described over here. I decorate the Create Order API operation with the following policy:
<emit-metricname="Order" value="1" namespace="apim-metrics">
   <dimensionname="Customer" value="@(context.Request.Body.As<JObject>(preserveContent: true)["customer"].ToString())"/>
   <dimensionname="Type" value="@(context.Request.Body.As<JObject>(preserveContent: true)["type"].ToString())"/>
   <dimensionname="Department" value="@(context.Request.Body.As<JObject>(preserveContent: true)["department"].ToString())"/>
</emit-metric>
This policy increases the Order metric, which is stored within the apim-metrics namespace, with 1 for every order that gets created. Multiple dimensions are configured, which retrieve their value from the JSON request body.
Remark that the dimension data could also extracted from the HTTP header, query string, access token or context variable. You can find here a list of common policy expressions that perform these kind of tasks.
Enjoy the result
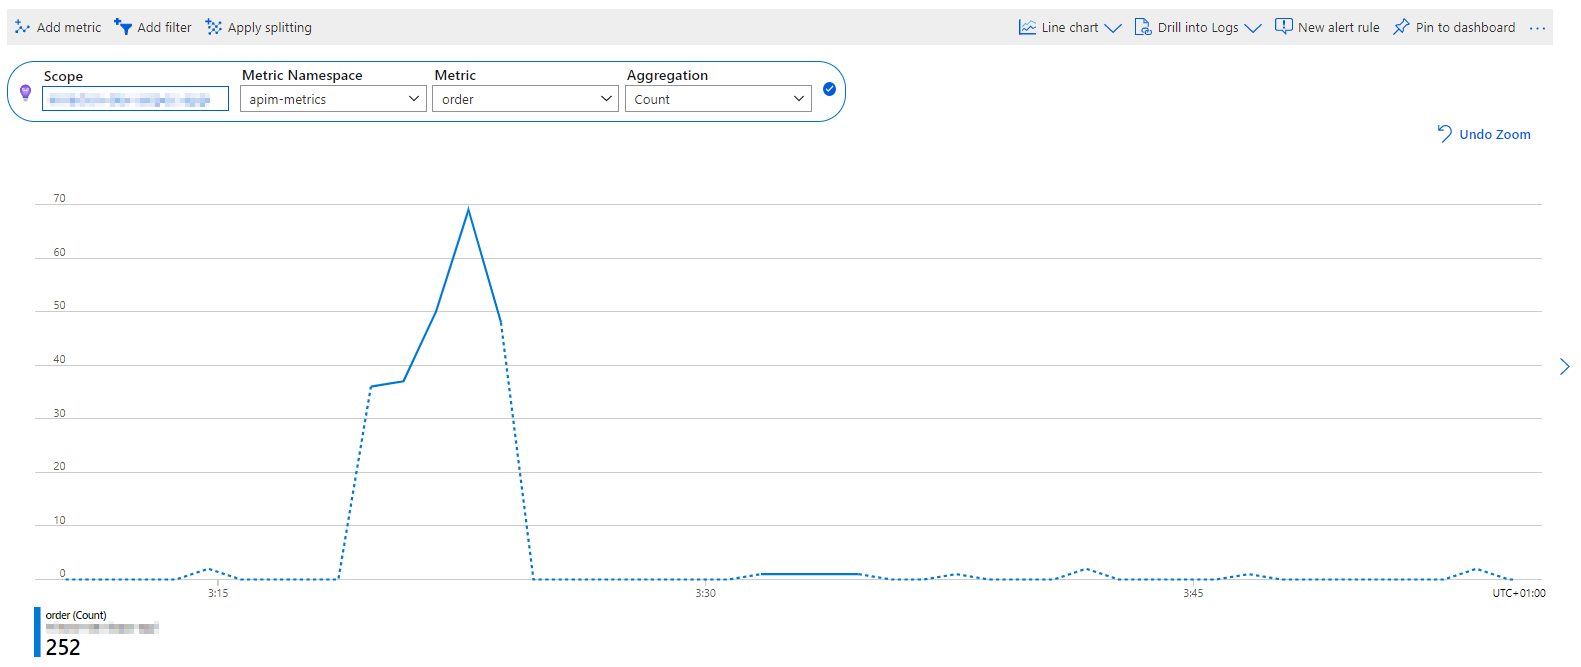
In the Metrics tab, you can visualize the results. Ensure that the scope is configured with the correct Application Insights instance and that you select the right metric and metric namespace. In this example, 252 orders have been processed.

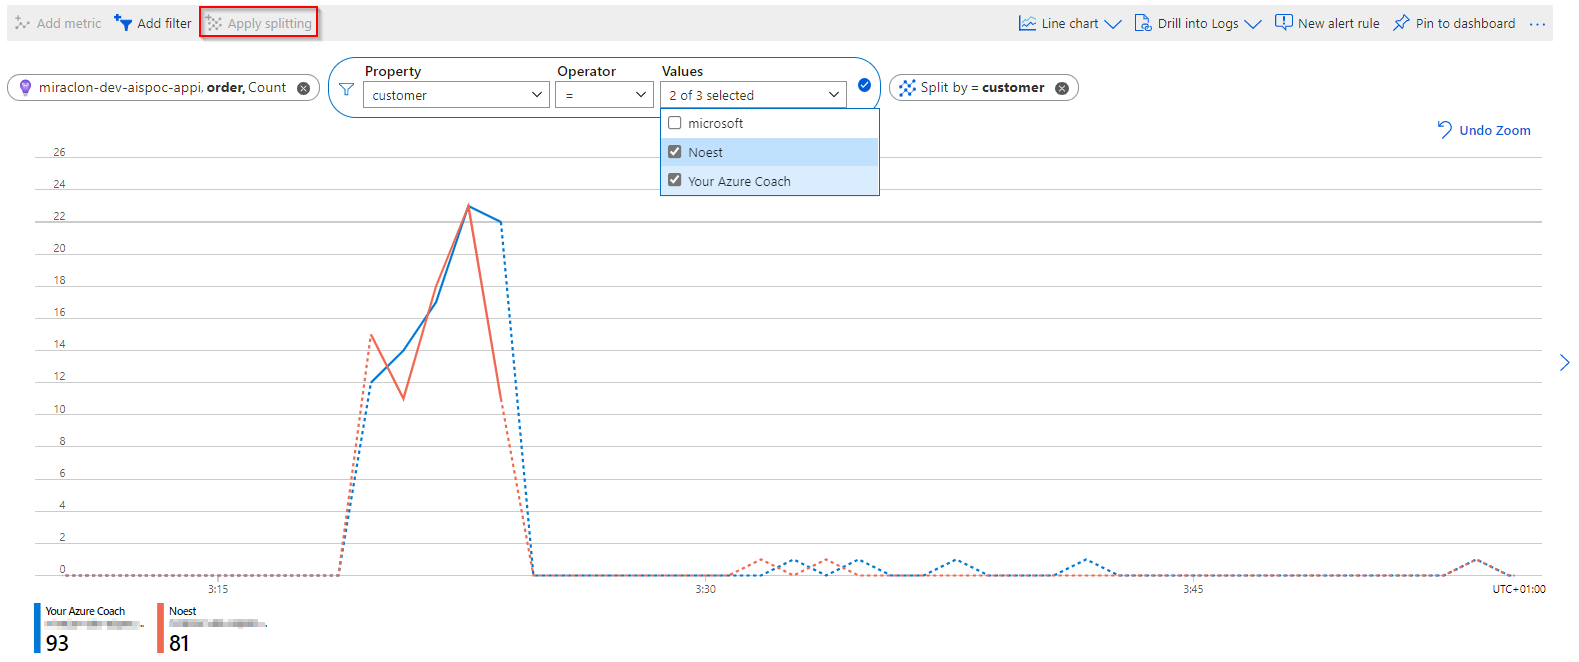
The real power of these multi-dimensional metrics is the fact that you can split and filter your metrics by dimension. In the screenshot below, you can see that 93 orders where created for Your Azure Coach and 81 for Noest. Microsoft is excluded from the filter.

Conclusion
That’s a really nice monitoring feature for API Management. Be aware that these metrics can be used in visualizations, but also for configuring pro-active alerts. Next to that, there is the option to connect Power BI to these datasets and foresee reporting on top of it. Every organization has to determine whether to use this feature in a more technical context (logging IP-Address, Subscription name, API name, Operation name…) and/or a rather functional context (business metadata).
Remember: sharing is caring!
Toon


